Quantcast
Channel: The RAS Solution
Viewing all 200 articles
Browse latest View live

1D? 2D? or 1D/2D? How Should I Build my Model?

$
0
0
Written by Christopher Goodell, P.E., D.WRE  |  WEST Consultants 
Copyright © The RAS Solution 2016.  All rights reserved. 


Now that the official release of HEC-RAS 5.0 is out with 2D capabilities, I'm getting a lot of questions about whether 1D or 2D (or 1D/2D combined) is the best way to set up a specific model.  The answer is very simple.  Like everything else...It depends!  Fortunately, there are some guidelines.  

1.  The general rule of thumb is that if the length-to-width ratio is larger than 3:1, a 1D model can possibly be used; otherwise, a 2D model is needed (source:  Desktop Review of 2D Hydraulic Modelling Packages, UK Environment Agency, 2009).  For example, if a river reach is 10,000 m long and has a 100 m wide floodplain, the ratio is 100 to 1, so a 1D model is likely okay.  For a river reach that is 10,000 m long but has a 5,000 m wide floodplain, the ratio is 2 to 1, so a 2D model will probably be needed.
2.  Features such as a narrow bridge crossing causes significant expansion/contraction are best modeled using 2D capabilities.
3.  If knowing the flood patterns around buildings and other discrete features is important, a 2D model will be necessary.
4.  Detailed animations showing floodwave progression in multiple directions at a local scale is best represented using a 2D model.  If simple water surface elevation graphics are needed, both 1D and 2D models can be used to produce these results.


When will a 1D model be suitable?

1.  Locations where flow isn’t required to ‘spread’ significantly (flow maintains primarily uni-directional flow patterns).
2.  Well-defined channel/overbank systems (channel is bounded by steep slopes, constricting the lateral expansion of flows).
3.  Simply-connected floodplains where flow in main channel is well connected to flow in the overbank and that flow in both is primarily uni-directional in nature.
4.  When elevation data of only limited quality/quantity are available.


When is a 2D model usually preferable?

1.  Anywhere flow is expected to spread
2.  Urbanized Areas
3.  Wide Floodplains
4.  Downstream of Levee Breaks
5.  Wetland Studies
6.  Lake or Estuary Studies
7.  Alluvial Fans


Other Considerations:
Like anything else, there is rarely a definitive answer to the subject question, rather a lot of gray area.  Frequently, a model could be constructed in 1D or 2D and provide excellent answers either way.  In this case, the experience of the modeler with 1D modeling or 2D modeling becomes very important.  Someone who is very skilled at setting up a 1D model to represent 1- and 2-D conditions (a quasi-2D model) may end up with a much better model than if that same person tried to build a 2D model without much experience in 2D modeling.  And vice-versa. 

There are pluses and minuses to going purely 2D.  First of all, if you can justify using Diffusion wave, a purely 2D model will most definitely be more stable and robust than a 1D or 1D/2D unsteady flow model.  You’ll be surprised how easy it is to set up and run.  Even if you do have to use Full Momentum, typically if your Courant Condition is well satisfied, the model will be more stable.  With multiple streams arranged with complicated junctions and loops, the 2D version will do a much better job – especially around junctions and flow transfers from one stream to another.  And you get to remove subjective modeling techniques like ineffective flow areas, levee markers, cross section orientation, etc.  Some downsides to a fully 2D model are: 
1.  Run times.  If your 2D area is very large and you have relatively small cells (i.e. a lot of cells), then run times can be long.  By a lot of cells, I’m talking about 100,000 to 1 million or more.  Making your model 2D in areas where you need detail and 1D everywhere else can help solve this problem. 
2.  Output.  Getting output from 2D areas is a bit more cumbersome and limited. Still, you can get quite a bit of stuff out of your 2D areas, it just might take more time. 
3.  In version 5.0, there is no direct way to model pressure flow at bridges in a 2D area. Hopefully this will change for the next version.
4.  Learning curve.  Being new to 2D modeling, there will be some overhead just learning how to do it. 
5.  Your client may not be okay with it.  Make sure your client is aware of the benefits of 2D modeling.  There is generally a perception that 2D modeling is more expensive.  This is not (should not) always be the case. 

And remember…

Make everything as simple as possible, but not simpler.
            -Albert Einstein (paraphrased)

For every complex problem there is an answer that is clear, simple, and wrong.
            -H.L. Mencken

For more information, make sure to give Chapter 6 of the new HEC-RAS 2D ModelingManual.


HEC-RAS 2D Training Course London, U.K. July 19-21, 2016

$
0
0

This will be a fantastic opportunity to learn how to set up and run 2D and 1D/2D HEC-RAS models using the newly released HEC-RAS 5.0.  I will be hosting this course in London England on July 19-21, 2016.  Don't wait to register!  This class is expected to fill up quickly.  


This course will take place in  London,  19-21 July, 2016 and will be taught by Mr. Chris Goodell of WEST Consultants and The RAS Solution.

The course will be held at the Imparandoconference/training facilities at - 56 Commercial Road, Aldgate East - E11LP in downtown London. 


Please register for the class using the following form:  
https://drive.google.com/file/d/0B0bpiyLiUeRXSVgtM0RpaUJXWEU/view?usp=sharing.

Getting Profile Output in a 2D Area

$
0
0
Written by Christopher Goodell, P.E., D.WRE  |  WEST Consultants 
Copyright © The RAS Solution 2016.  All rights reserved. 

Back in September 2015, I wrote an article on how to extractflow data from a transect in a 2D area.   This was a round-about way of getting flow flux data out of RAS Mapper.  Back then the beta version of HEC-RAS 5.0 was somewhat limited in the ways data could be extracted from a 2D area.  In the final release of Version5.0, you may have noticed in the bottom left-hand corner of RASMapper, there is a very unassuming tab called “Profiles Lines”. 


Profile Lines are another way of extracting linear data from a 2D area, only these are extracted longitudinally, like a profile plot.  Here’s how it works:


      1.  Run your project and then open up RAS Mapper.  Activate your results by checking either the Depth, Velocity, or WSE output layer.  Turning on the particle tracing might help guide where you place your profile line.

2.  Select the Profile Lines tab.  Click the “+” button to draw a new profile line on your 2D area.  Double click to end the line and when prompted, give it a name.  Here I’ve named it “Profile 1” and it is stored in the Profile Lines bin.


     3.  Now select the pointer from the toolbar at the top and then right-click anywhere on your profile line.  Whatever results layers you have checked in the layer manager will be available as profile plots.


     4.   Click on whichever value you would like to see for the profile plot.  Here we can the see water surface elevation profile.  Notice that the terrain is included on this plot for reference. 


And the velocity profile:


And the depth profile:


HEC-RAS Version 5.0.1 is now Available!

$
0
0
A new "bug-fix" version of HEC-RAS has just been released (5.0.1).  A few computational bugs were identified since the release of 5.0, which were severe enough that HEC needed to fix them promptly.


You can download the latest version from the HEC web page:


http://www.hec.usace.army.mil/software/hec-ras/


The following is a list of bugs that were found in version 5.0 and fixed for version 5.0.1:

1. Unsteady Flow with Pumps: A pumping station that is connected "From" a storage area had a bug that could generate an "access violation" error.

2. Unsteady flow with rating curves at structures: The rating curves for: inline structure outlet rating curve, lateral structure outlet rating curve, and user defined gate rating curves (both inline and lateral) have been changed so that unsteady will no longer extrapolate past the top or bottom of the curve. A warning will be generated the first time this happens.

3. Unsteady flow with an SA/2D Hydraulic Conn between two 2D areas: There was a bug when a SA/2D connector has a 2D area on the upstream side. This bug would sometimes show up as an "access violation" error.

4. Steady Flow Analysis (Encroachments at Bridges): There was a bug when type 1 encroachments were specified immediately adjacent to a bridge opening. The encroachment was being set to the opening. The left encroachment was set to the left side of the bridge opening and the right encroachment was being set to the right edge of the opening.

5. Unsteady flow with 2D areas/Internal Hydraulic connector: For a hydraulic connector inside of a 2D area, the DSS output for headwater and tailwater had a bug. The reported values were "one cell" away from the intended values. For a connection that was entirely inside of a single cell, this resulted in a reported water surface of "0.0". This was only a reporting issue.

6. 1D Velocity plotting in HEC-RAS Mapper for metric data sets: 1D HEC-RAS Mapper maximum velocity plot was wrong for SI data sets.

7. Unsteady flow Lateral Structure connected to a 2D flow area: For a lateral structure connected between a 1D river and a 2D area, the lateral structure was pulling the water out of the river at the wrong cross section location. The flow was being re
moved from the 1D river upstream of the location it should have been removing it from.

8. User Interface – Right Bank of Main channel: If you had a cross section with a vertical wall at the right bank of the main channel, the interface was displaying the main channel bank station at the bottom of the vertical wall. The computations were correct, this was just a visual problem in the interface.

Benchmarking of the HEC-RAS Two-Dimensional Hydraulic Modeling Capabilities

$
0
0
HEC has released a new HEC Research Document called “Benchmarking of the HEC-RAS Two-Dimensional Hydraulic Modeling Capabilities”.  This research document summarizes how the Hydrologic Engineering Center's (HEC) River Analysis System (HEC-RAS) software performed in the two-dimensional (2D) modeling benchmark tests developed by the United Kingdom's (UK) Joint Defra (Department for Environmental Food and Rural Affairs) Environment Agency.  These Benchmarking Tests are widely used to compare 2D models over a wide range of flow situations.


Please foreword this post to anyone you know that would be interested in this document.

HEC-RAS 2D Modelling Training in London July 19-21, 2016

$
0
0


This will be a fantastic opportunity to learn how to set up and run 2D and 1D/2D HEC-RAS models using the newly released HEC-RAS 5.0.  I will be hosting this course in London England on July 19-21, 2016.  Register now!  Space is limited!

Please go here to register for the class.
  

If you have any questions, or to express interest in the class, please email Chris Goodell at cgoodell@westconsultants.com


This course will take place in  London,  19-21 July, 2016 and will be taught by Mr. Chris Goodell of WEST Consultants and The RAS Solution.


The course will be held at the Imparando conference/training facilities at - 56 Commercial Road, Aldgate East - E11LP in downtown London. 


Please register for the class using the following form:  
https://drive.google.com/file/d/0B0bpiyLiUeRXSVgtM0RpaUJXWEU/view?usp=sharing.

Since the beta version of HEC-RAS 5.0 was released in 2014 Chris Goodell has given the HEC-RAS 2D Modeling class more than 15 times throughout the United States and around the world in places like Pretoria, Milan, and Melbourne. 

Bridges in 2D Areas

$
0
0
Written by Christopher Goodell, P.E., D.WRE  |  WEST Consultants 
Copyright © The RAS Solution 2016.  All rights reserved. 

There have been a lot of requests for examples of how to model bridges in 2D areas.  First, let me state up front that in the current version (5.0.1) there is no direct way to put a bridge in a 2D area, like you would in a 1D reach.  That means, that we currently don’t have a way to use low flow bridge modeling approaches like Energy, Momentum, Yarnell, and WSPRO.  Likewise, you can’t use the high flow approaches (Energy, Pressure/Weir).  Hopefully this will be added to a future version. 

That being said, I’ll present three options for simulating bridges in 2D areas.  To demonstrate these options, I used a dam breach model adapted from HEC’s Bald Eagle Creek data set.  The animation is included at the end of this article. 

Option 1. Simply modify the terrain to include the bridge embankments, abutments, and even piers.  This requires a little work in GIS manually editing the terrain to include those features.  If you have a RAS model and you don’t want to get into GIS at all, this is probably not the right method for you.  However, if you are modeling an existing bridge, look closely at your terrain. You might see that the bridge components (minus the deck and piers) are already in there.  When processing LiDAR data, it’s common to remove the bridge deck, but leave the roadway approaches and abutments.  This may be sufficient enough, especially if the depth of water doesn’t get high enough to impact the bridge deck and there are no piers, or they are relatively small compared to the bridge opening.  In this case, RAS will just use the regular 2D St. Venant equations to model flow through the bridge opening. 

Here’s an example that shows a bridge that could be modeled using Option 1. 


Notice the bridge deck appears to be inundated.  Don't be fooled by this.  The deck is actually higher than the roadway approaches (which are dry), but since it’s not included in the terrain, RAS doesn’t know it’s there-it only sees the roadway approaches and the bridge abutments (see next figure).  The deck is in fact not impacted in this case.  Since the deck is not impacted, we can model this bridge using the existing terrain.  In this case RAS will use the 2D St. Venant equations to compute stages and flows through the bridge opening.  I’m not sure if there are piers under this bridge or not.  If there were, you could either ignore them (if they’re relatively small) or try to work them into the terrain somehow.  I suppose if you really wanted to get crazy you could make a very small 2D area connection for each pier, or even use very high n values in the cells that the piers occupy. 

When setting up your geometry to model this as a bridge, there’s really not much to it.  You are basically using the existing terrain and laying a mesh on top of it.  However, it is important to establish cell faces along the top of roadway, since it will be acting as a barrier to flow.  You can easily do this by drawing and enforcing breaklines as shown below with the red polylines.
  

Advantages:  
  • Easy to set up for existing bridges that are included as part of the terrain.
Disadvantages:  
  • Requires manually editing your terrain if you want to model a proposed bridge.  
  • Can only simulate low flow through a bridge (can’t impact the bridge deck).  
  • Can’t simulate piers.

Option 2.  Use a SA/2D Area Connection with a culvert (or culverts).  This is particularly useful for wider bridges with relatively small openings when the bridge deck is impacted during the flood.  If the bridge has piers, you can use multiple culverts, the spacing between them is what simulates the piers.  In this example (same HEC-RAS dataset), you can clearly see that this bridge, its abutments, and its roadway approaches are overtopped by the flood.    


Here I’ve inserted a SA/2D Area Connection for the bridge.  


Although it is technically a bridge, we can simulate it with a culvert by using a box that has the same width and height as the bridge opening.  Simply measure the width and height of the bridge opening and use that for the span and rise of the box culvert.  I grabbed the dimensions of the bridge opening from the 1D version of the Bald Eagle dataset (converted from English Units).  Try to get this as close as possible, although you’ll not get it exactly the same. 


Although this is relatively easy to do, especially if you have the bridge dimensions on hand, it would be wise to calibrate this to the original model.  Since bridges can’t be used directly in 2D areas, you’ll have to do your calibration in a 1D version of your model.  Typically you’ll focus on the inlet coefficient, n values and the culvert width (span) as your calibration parameters.  Try to replicate the stage hydrograph as closely as you can (this is usually difficult to do), but at least calibrate to the timing and water surface elevation of the maximum inundation.   

Advantages:  
  • Can simulate low flow and high flow conditions (i.e. bridge overtopping).
Disadvantages:  
  • Uses culvert equations to model a bridge.  
  • You may not be able to get the culvert shape to perfectly match the bridge opening.
  • Requires calibration. 

Option 3.  Use a SA/2D Area Connection with a gate (or gates).  This is particularly useful for narrower bridges with relatively large openings when the bridge deck is impacted by the flood.  If the bridge has piers, you can use multiple gates, the spacing between them used to simulate the piers.  In this example (again…same dataset), it’s hard to tell if the bridge overtops, since there are some dry areas on either side of the deck.  However, it is close.  And if there is any thickness to the deck at all, it is likely that there will at least be pressure flow. We'll verify this later.

 
Again, I’ve inserted a SA/2D Area Connection for the bridge. 


From here, the technique is very similar to Option 2, only you’ll use gates instead of culverts.  Again, get the dimensions of the bridge opening and use that to size the gates.  In this example, there are two piers, so I’ll put in three gates (the space between the gates simulates the piers). 

Here’s the bridge as it is input to the 1D version of the Bald Eagle dataset:


…and in the 2D model using gates:

To simulate the two piers, I had to create three different gate groups, since the resulting openings are all slightly different. 


One unique consideration for Option 3 is that you have to add time series boundary conditions for operation of the gates.  It’s easy to do, you just have to create a new unsteady flow file and add in the boundary conditions.  Just set the gates to be fully open for the entire simulation. And don’t forget to set the time series for all three gates. You'll get a somewhat unhelpful message if you do forget. 


As with culverts, it’s important to calibrate your gate version of the bridge to the bridge in the 1D version of the model.  For gates, you’ll want to focus on the weir coefficient and the sluice discharge coefficient as well as the width of the gates for your calibration parameters. 

Advantages:  
  • Can simulate low flow and high flow conditions (i.e. bridge overtopping).
Disadvantages:  
  • Uses gate equations to model a bridge.  
  • You may not be able to get the gate shape to perfectly match the bridge opening.
  • Requires calibration.  
  • Requires additional boundary conditions (time-series gate openings).

Output:
When checking output, you will get stage and flow hydrographs for the two methods that use SA/2D Area connections.  However, you’ll find they are generally not too useful-they're geared more towards presenting 1D simulation results.  In 2D areas, I prefer to use the Profile Lines.  Below, I plotted both the maximum water surface elevation on the terrain profile as well as the velocity profile.  If you revisit the plot shown above of the SA/2D Area Connection that represents this bridge, you’ll see that the bridge deck upper chord is at an elevation of approximately 174.3 meters.  And the lower chord of the deck is approximately 173.2 meters.  Therefore, the bridge doesn’t overtop during the simulation, but it does go into pressure flow. 

Also, you can clearly see that the right bank will get some potentially damaging velocities! (This is after all, a dam breach simulation). 


It’s interesting-this velocity hotspot is not what you might think.  I initially assumed that this was velocity in the direction of the creek, moving “downstream”-the velocity we typically consider when determining abutment scour.  However, when plotting the particle tracing and velocity vectors on top of the water surface elevation layer, you can see that this is actually high velocity from water spilling over the bank (again, this is a dam breach model, which is why you have water spilling from the overbank into the channel).  The drop in water surface elevation over the bank is about 3 meters!


Here is a zoomed-out view of the dam breach flood event.  Look closely during the animation-the cursor points out the three bridges that were modified for this article.  


Do any of you have any other ways to model bridges in 2D areas?  If so, please share!

Bridges in 2D Areas-Important Update!

$
0
0
Written by Christopher Goodell, P.E., D.WRE  |  WEST Consultants 
Copyright © The RAS Solution 2016.  All rights reserved. 

***Update:  I received a few very important comments about this post that I want to share.  

First, and this is very important:  These methods are not meant to be used to do any kind of detailed bridge design or bridge scour analysis (contraction, abutment, or pier scour).  The methods I present in this post are strictly as a means to include a bridge in a 2D area to gage its effect on the overall resulting flood inundation.  Meeting FHWA standards for bridge modeling requires much more information than these options will provide you.  


Second, Mark Forest posted a couple of very good comments that I would like to share. Please read his comments at the end of this post.


There have been a lot of requests for examples of how to model bridges in 2D areas.  First, let me state up front that in the current version (5.0.1) there is no direct way to put a bridge in a 2D area, like you would in a 1D reach.  That means, that we currently don’t have a way to use low flow bridge modeling approaches like Energy, Momentum, Yarnell, and WSPRO.  Likewise, you can’t use the high flow approaches (Energy, Pressure/Weir).  Hopefully this will be added to a future version.  

That being said, I’ll present three options for simulating bridges in 2D areas.  

To demonstrate these options, I used a dam breach model adapted from HEC’s Bald Eagle Creek data set.  The animation is included at the end of this article. 

Option 1. Simply modify the terrain to include the bridge embankments, abutments, and even piers.  This requires a little work in GIS manually editing the terrain to include those features.  If you have a RAS model and you don’t want to get into GIS at all, this is probably not the right method for you.  However, if you are modeling an existing bridge, look closely at your terrain. You might see that the bridge components (minus the deck and piers) are already in there.  When processing LiDAR data, it’s common to remove the bridge deck, but leave the roadway approaches and abutments.  This may be sufficient enough, especially if the depth of water doesn’t get high enough to impact the bridge deck and there are no piers, or they are relatively small compared to the bridge opening.  In this case, RAS will just use the regular 2D St. Venant equations to model flow through the bridge opening. 

Here’s an example that shows a bridge that could be modeled using Option 1. 


Notice the bridge deck appears to be inundated.  Don't be fooled by this.  The deck is actually higher than the roadway approaches (which are dry), but since it’s not included in the terrain, RAS doesn’t know it’s there-it only sees the roadway approaches and the bridge abutments (see next figure).  The deck is in fact not impacted in this case.  Since the deck is not impacted, we can model this bridge using the existing terrain.  In this case RAS will use the 2D St. Venant equations to compute stages and flows through the bridge opening.  I’m not sure if there are piers under this bridge or not.  If there were, you could either ignore them (if they’re relatively small) or try to work them into the terrain somehow.  I suppose if you really wanted to get crazy you could make a very small 2D area connection for each pier, or even use very high n values in the cells that the piers occupy. 

When setting up your geometry to model this as a bridge, there’s really not much to it.  You are basically using the existing terrain and laying a mesh on top of it.  However, it is important to establish cell faces along the top of roadway, since it will be acting as a barrier to flow.  You can easily do this by drawing and enforcing breaklines as shown below with the red polylines.
  

Advantages:  
  • Easy to set up for existing bridges that are included as part of the terrain.
Disadvantages:  
  • Requires manually editing your terrain if you want to model a proposed bridge.  
  • Can only simulate low flow through a bridge (can’t impact the bridge deck).  
  • Can’t simulate piers.

Option 2.  Use a SA/2D Area Connection with a culvert (or culverts).  This is particularly useful for wider bridges with relatively small openings when the bridge deck is impacted during the flood.  If the bridge has piers, you can use multiple culverts, the spacing between them is what simulates the piers.  In this example (same HEC-RAS dataset), you can clearly see that this bridge, its abutments, and its roadway approaches are overtopped by the flood.    


Here I’ve inserted a SA/2D Area Connection for the bridge.  


Although it is technically a bridge, we can simulate it with a culvert by using a box that has the same width and height as the bridge opening.  Simply measure the width and height of the bridge opening and use that for the span and rise of the box culvert.  I grabbed the dimensions of the bridge opening from the 1D version of the Bald Eagle dataset (converted from English Units).  Try to get this as close as possible, although you’ll not get it exactly the same. 


Although this is relatively easy to do, especially if you have the bridge dimensions on hand, it would be wise to calibrate this to the original model.  Since bridges can’t be used directly in 2D areas, you’ll have to do your calibration in a 1D version of your model.  Typically you’ll focus on the inlet coefficient, n values and the culvert width (span) as your calibration parameters.  Try to replicate the stage hydrograph as closely as you can (this is usually difficult to do), but at least calibrate to the timing and water surface elevation of the maximum inundation.   

Advantages:  
  • Can simulate low flow and high flow conditions (i.e. bridge overtopping).
Disadvantages:  
  • Uses culvert equations to model a bridge.  
  • You may not be able to get the culvert shape to perfectly match the bridge opening.
  • Requires calibration. 

Option 3.  Use a SA/2D Area Connection with a gate (or gates).  This is particularly useful for narrower bridges with relatively large openings when the bridge deck is impacted by the flood.  If the bridge has piers, you can use multiple gates, the spacing between them used to simulate the piers.  In this example (again…same dataset), it’s hard to tell if the bridge overtops, since there are some dry areas on either side of the deck.  However, it is close.  And if there is any thickness to the deck at all, it is likely that there will at least be pressure flow. We'll verify this later.

Again, I’ve inserted a SA/2D Area Connection for the bridge. 


From here, the technique is very similar to Option 2, only you’ll use gates instead of culverts.  Again, get the dimensions of the bridge opening and use that to size the gates.  In this example, there are two piers, so I’ll put in three gates (the space between the gates simulates the piers). 

Here’s the bridge as it is input to the 1D version of the Bald Eagle dataset:


…and in the 2D model using gates:

To simulate the two piers, I had to create three different gate groups, since the resulting openings are all slightly different. 


One unique consideration for Option 3 is that you have to add time series boundary conditions for operation of the gates.  It’s easy to do, you just have to create a new unsteady flow file and add in the boundary conditions.  Just set the gates to be fully open for the entire simulation. And don’t forget to set the time series for all three gates.  You'll get a somewhat unhelpful message if you do forget. 


As with culverts, it’s important to calibrate your gate version of the bridge to the bridge in the 1D version of the model.  For gates, you’ll want to focus on the weir coefficient and the sluice discharge coefficient as well as the width of the gates for your calibration parameters. 

Advantages:  
  • Can simulate low flow and high flow conditions (i.e. bridge overtopping).
Disadvantages:  
  • Uses gate equations to model a bridge.  
  • You may not be able to get the gate shape to perfectly match the bridge opening.
  • Requires calibration.  
  • Requires additional boundary conditions (time-series gate openings).

Output:
When checking output, you will get stage and flow hydrographs for the two methods that use SA/2D Area connections.  However, you’ll find they are generally not too useful-they're geared more towards presenting 1D simulation results.  In 2D areas, I prefer to use the Profile Lines.  Below, I plotted both the maximum water surface elevation on the terrain profile as well as the velocity profile.  If you revisit the plot shown above of the SA/2D Area Connection that represents this bridge, you’ll see that the bridge deck upper chord is at an elevation of approximately 174.3 meters.  And the lower chord of the deck is approximately 173.2 meters.  Therefore, the bridge doesn’t overtop during the simulation, but it does go into pressure flow. 

Also, you can clearly see that the right bank will get some potentially damaging velocities! (This is after all, a dam breach simulation). 


It’s interesting-this velocity hotspot is not what you might think.  I initially assumed that this was velocity in the direction of the creek, moving “downstream”-the velocity we typically consider when determining abutment scour.  However, when plotting the particle tracing and velocity vectors on top of the water surface elevation layer, you can see that this is actually high velocity from water spilling over the bank (again, this is a dam breach model, which is why you have water spilling from the overbank into the channel).  The drop in water surface elevation over the bank is about 3 meters!


Here is a zoomed-out view of the dam breach flood event.  Look closely during the animation-the cursor points out the three bridges that were modified for this article.  


Do any of you have any other ways to model bridges in 2D areas?  If so, please share!

Mark ForestPractice Leader - Floodplain Management and Modeling at HDR Engineering has the following to add:  "That is a good summary. I would note that if you include the piers in the terrain, it is important to build breaklines through the piers and use a small enough grid spacing around the piers if you want them to be properly simulated as obstructions to the flow path. Otherwise they just displace volume. Also, the impact of the piers really requires the full momentum solution as well. The run-up on the face of the pier will be seen with the full momentum solution when properly gridded around the pier. Also, when you are attempting to simulate flow around the abutments (that you have carefully incorporated into the terrain), it will require a finer mesh around the abutments to capture the more detailed velocity distribution in that part of the model domain. 

Non-pressure flow bridges can be effectively modeled this way, if the terrain has been properly captured.


 I would also note that, the region under a bridge deck is not going to be properly captured with LiDAR data since the bridge deck obscures the returns. This usually leaves a "hump-like" feature in the LiDAR data set under the deck. This has to be manually cleaned up in order to model this with 2D. With a 1D model this is not typically a problem since you are extracting the sections for the bridge faces outside of the zone of bad data. But, with the 2D solution, that hump under the deck will be seen as an obstruction to flow through the opening."


HEC-RAS 2D en España - HEC-RAS 2D in Spain

$
0
0
Para los compañeros usuarios de HEC-RAS viviendo dentro o cerca de España, mi colega Marty Teal estará dictando dos cursos de modelación bidimensional con HEC-RAS5.0 allá en Octubre: en Barcelona el 19-21 y en Sevilla el 24-26.

Me gustaría estar allá pero Marty habla español mucho mejor que yo :-)
Vaya aquípara más información.

For my fellow HEC-RAS Users who are in or around Spain, my colleague Marty Teal will be teaching our HEC-RAS 5.0 2D Course in two locations in October 2016.  Oct 19-21 in Barcelona and Oct 24-26 in Seville.

Wish I could be there, but Marty speaks much better Spanish then I do. :-)
For more information, click here.


And for you English-speaking HEC-RAS users, there is still space for more attendees at the London class in July.  But don't wait too long to register, there will be a limit.

Last Chance to Register for HEC-RAS 2D in London July 19-21.

$
0
0


Less than one month away so we're making the final call.  This is your last opportunity to register for this class.  This will be a fantastic opportunity to learn how to set up and run 2D and 1D/2D HEC-RAS models using the newly released HEC-RAS 5.0.  I will be hosting this course in London England on July 19-21, 2016.  Register now!  Space is limited!

Please go here to register for the class.
  

If you have any questions, or to express interest in the class, please email Chris Goodell at cgoodell@westconsultants.com


This course will take place in  London,  19-21 July, 2016 and will be taught by Mr. Chris Goodell of WEST Consultants and The RAS Solution.

The course will be held at the Imparando conference/training facilities at - 56 Commercial Road, Aldgate East - E11LP in downtown London. 


Please register for the class using the following form:  
https://drive.google.com/file/d/0B0bpiyLiUeRXSVgtM0RpaUJXWEU/view?usp=sharing.

Since the beta version of HEC-RAS 5.0 was released in 2014 Chris Goodell has given the HEC-RAS 2D Modeling class more than 15 times throughout the United States and around the world in places like Pretoria, Milan, and Melbourne. 

Tips and Tricks for Modeling Irrigation Canals and Structures in HEC-RAS

$
0
0
Written by Brian Wahlin, Ph.D., P.E., D.WRE | WEST Consultants
Copyright © The RAS Solution 2016.  All rights reserved.

In an earlier blog post, we discussed some details regarding modeling overflow gates in HEC-RAS.

These gates are typically used in irrigation canals. This blog post generated many interesting questions and comments regarding modeling irrigation canals in general using HEC-RAS. Thus, we felt it might be interesting to address some of these questions in a blog post devoted solely to modeling irrigation canals and structures using HEC-RAS.


One of the questions from the overflow gates blog post was:

“I have a question about external data interface for canal automation (EDI). I wanted to know if the project was success full [sic] and could simulate the real canal system.
I have seen in some articles that using Saint Venant equations is too complicated for canal automation purposes and needs lots of data. Instead they suggest to use industrial control system approach. Furthermore, in a book which has been published by ASCE http://www.asce.org/templates/publications-book-detail.aspx?id=6965, they suggest that to use similar approaches. I want to know your opinion.”

This question covers many topics from modeling irrigation canals using HEC-RAS to designing automatic controllers for irrigation canals.  It also references a project we completed several years ago where we linked an unsteady HEC-RAS model of the Central Arizona Project (CAP) Canal to a Supervisory Control and Data Acquisition (SCADA) program so that the operators of the CAP Canal could be trained using a hydraulic model rather than by operating the real canal.  CAP has an extensive SCADA system that allows them to monitor and control the entire 336-mile canal from their central control room.  

This is similar to the concept of how pilots are trained using a flight simulator instead of flying a real plane.  In a way, we created a “flight simulator” for canal operators.  To make this project successful, we had utilized many of the HECRASController routines and had to create a program that linked HEC-RAS to the SCADA system.  We called this program the External Data Interface (EDI).  We are also pleased that the question references the newly published ASCE Manual of Practice (MOP)131 Canal Automation for Irrigation Systems. This new publication is intended to be an update on recent advances in canal automation.  On a side note, I was one of the editors for MOP 131, so thanks for the plug on the book!

In reading this question, we first need to clarify something. As the reader points out, it is true that using the St. Venant equations to design a controller is not a good idea because of the non-linearity of those equations. Thus, controllers are typically designed using some sort of linearized approximations of the system (i.e., industrial control system approach).

However, when testing the performance of a designed controller, it is no problem to test them via simulations using the full St. Venant equations using unsteady HEC-RAS. In fact, you want to do this to make sure that the designed controller (designed using simplified linear approximations) will behave as expected in the real nonlinear world.

The EDI program that the reader refers to did work successfully. We were able to model the unsteady hydraulics of the CAP Canal successfully and had calibration data to verify the model performance. In this particular project, we did not actually design feedback controllers or test the controllers via hydraulic simulation as that was not the goal of the project. Instead, we used the EDI as an interface between the HEC-RAS model of the canal and the SCADA system used to manually monitor and control the canal (manual-centralized control). As mentioned earlier, the EDI program was crucial in making the canal operator “flight simulator” work. A schematic diagram of how the “flight simulator” for irrigation canals is set up and how the EDI program fits into this scheme is shown below. Note that the SimSuite program in the figure is a program that emulated field hardware and maintained physical information such as gate positions, water levels, and turnout flows.  SimProctor is a program used to assist in the training of the canal operators.


After posting the above response, the reader came back with a series of questions.  So, let’s go through these follow-up questions:

1.   “I was wondering if there is any publication available for the methodology which has been implemented in this project.”

      Yes, the results of our “flight simulator” project for the CAP was published in the proceedings for a US Committee on Irrigation and Drainage conference a few years ago.  We will also be speaking about this topic again at the upcoming ISHS conference in Portland in June 2016.  A link to the ISHS conference paper is given here:  https://drive.google.com/file/d/0B0bpiyLiUeRXRzBoUW9IRlpLQ28/view?usp=sharing
    
      2.  “How did you calibrate the model?”

      CAP collects data for the canal on a regular basis.  These data include water depths, gate openings, and flow rate estimates.  We used this information to adjust gate discharge coefficients and Manning’s roughness coefficients to perform the calibration of our model of the canal.  If you are doing an unsteady calibration, you will want to have the initial conditions start off at a steady state condition.
   
      3.   “Did you calibrate the pools one by one or calibrated [sic] couple of pools together?”

      Adjusting the gate discharge coefficients and Manning’s roughness coefficients can affect the water levels upstream and downstream if the gates are submerged.  Thus, we adjusted the gates one at a time, but always checked to make sure that the entire system calibration looked good as we were moving from one gate to the other.

      4.  “How did you model turnouts in HEC-RAS? Did you have instability issues in the turnouts?”

      Yes, we modeled turn outs.  The turnouts on the CAP Canal are locally automated to deliver a constant flow rate to the turnout regardless of the water level or flow rate in the canal.  Thus, the turnouts were modeled as constant outflow hydrographs (unsteady).  If you are doing a steady model, the turnouts would be modeled as a flow change location.  If you want your turnout to have the flow vary as a function of head in the canal, then you can place a lateral structure where the turnout is located and then put a gate on that lateral structure.  RAS will then calculate the flow through the gate based on the head from the water surface in the main canal.  If you are not modeling the water after it leaves the turnout, just have RAS remove the water from the system.  If you are modeling the water after it leaves the turnout, you will have to create another reach in RAS to model the lateral canal that the water from the turnout flows into.  You should not see instability issues due to turnouts. The photo above shows a typical turnout structure on an irrigation canal.

      5.   “Can HEC-RAS model water levels with +/- 5 centimeter accuracy in irrigation canals?”

      That really depends on how accurate your data are.  If you have poor information about your canal (e.g., you don’t have as-built plans or there has been settlement in the lining or there is lots of seepage), then you may not be able to get 5 cm accuracy.  Probably the largest uncertainty in the canals will be the flow rates.  You most likely will not know the flows in the canal to with +/- 5% unless you have very accurate flow measurement devices installed.  One suggestion would be to run a sensitivity test on the canal by varying the flows to get an idea regarding how much the water surfaces will fluctuate due to the uncertainty in your flow rates.

      Typically in an irrigation system, the water level upstream of a check gate is the “most important” depth.  The predicted water level at this location heavily depends on the gate discharge coefficient and the Manning’s roughness coefficient.  So if you do not know the gate discharge coefficient (and don’t have any calibration data to determine what it should be), then the water levels upstream of the check can be off by quite a bit.  The plot below shows the calibration results for an irrigation canal, where the diamond shapes indicate observed water levels. You can see from this plot that our calibrated model agrees well with some of the observed data points.  For other data points, there is some difference between the computed results in HEC-RAS and the observed data. Most likely, the areas where our calibration did not agree well were a result of the uncertainty in the observed data or flow rates.


6.  “What parameters did you put from [sic] designed controller in HEC-RAS?”

      Feedback controller design for irrigation canals in a complex topic.  We like to design the controllers for an irrigation canal using a linear approximation of the real canal using something called the integrator-delay model.  Using this model, the only two parameters needed to design the controller would be the delay time and the backwater surface area behind the pool. Both of these parameters can easily be obtained using your HEC-RAS model. These parameters are needed for each pool in your system.  Of course, these parameters can change as the flow rate changes, so if you design your controller for one flow rate and operate it at a completely different flow rate, the controller performance will not be as expected.  For canal pools that are completely under backwater, controller design is more complicated because of resonance that results from reflection waves. Details on modeling canals for controller design can be found in the ASCE MOP 131.  To actually design the controller, you can use techniques like Linear Quadratic Regulator or Model Predictive Control.  All of these topics are described in the ASCE MOP 131.

      7.  “Is it possible to use such approach for earthen canals? Do I need to re-calibrate the model after couple of years due to sediment and weeds?”

      Yes, you can use HEC-RAS to model an earthen canal.  Sediment and weeds can influence the Manning’s roughness coefficients.  Thus, the canal may respond differently over time due to weed growth and sediment, so this is something that you should consider. The figure below shows weeds growing along the banks of an earthen irrigation canal as well as along the bottom of the canal. These weeds were seasonal and only appeared in the summer months.  Another issue would be canal seepage in earthen canals.  If you performed a seepage test on a canal pool, you could get an estimate of the rate of water loss from the pool.  You could then model this seepage from the canal using unsteady outflow hydrographs or possibly the groundwater interflow internal boundary condition.  Without performing a seepage test, you would really need very good (and detailed) calibration data to determine the seepage losses.


8.  “Do you have any instability issues due to sudden opening/closing of the gates?”

      You can have instabilities any time you make a sudden change in RAS while using unsteady flow.  However, we have typically been able to get around these problems by adjusting the time step, the cross-sectional spacing, and the HTABs.  The CAP Canal model we mentioned had an inverted siphon immediately downstream of the check gates.  When the gates were slammed shut, the siphon would dry up and crash the model.  In this unique situation, pilot channels helped eliminate the instability.

      9.  “Have you built any physical model in a lab for irrigation canals and made a HEC-RAS model of the same canal and then compared the results?” 

      No, we have not done that and do not know of any situations where this has been done.

      10.  “Is it possible to use HEC-RAS to model sediment transport in irrigation canals? Is this model reliable?”

      Yes, it is possible to use HEC-RAS for sediment transport in irrigation canals.  A sediment transport model for an irrigation canal would be just as reliable as any other sediment transport model, which means it really depends on how the model is set up, what data are available, etc.  Care needs to be taken to use the correct sediment transport function for the canal.  Alternatively, there is a model developed specifically for sediment transport in irrigation canals called SETRIC, which was developed by IHE in the Netherlands.  If you are concerned about modeling the sediment transport in an irrigation canal, SETRIC may be a good option for you.


Weir Equations in HEC-RAS

$
0
0
Written by Christopher Goodell, P.E., D.WRE  |  WEST Consultants 
Copyright © The RAS Solution 2016.  All rights reserved. 


HEC-RAS has the ability to simulate flow at hydraulic controls in a variety of ways.  
Bridges, culverts, inline structures, lateral structures, and SA/2D area connections can all act as hydraulic controls.  Effectively, they break up the conservation equations used between cross sections in a 1D reach and/or cells in a 2D area with empirically derived (and usually very stable!) equations.  Weir equations can be used to define flow over an obstruction and are available with all of the 5 hydraulic controls identified above.  However, there are a number of options to consider when selecting simulating weir flow in HEC-RAS.  HEC-RAS approaches weir flow with three different cases:  Ungated Inline Weirs, Ungated Lateral Weirs, and Gated Weirs.  They all begin with the same standard equation:

                                                                  (1)

Where:  Q = discharge, C =weir coefficient, L = weir crest length, H = Energy head over the weir crest.

But each of the three cases apply the weir equation slightly differently. 

Before I continue, I should discuss the difference between the weir coefficient and the discharge coefficient.  I see both of them used interchangeably, but they ARE different.  The weir coefficient (as shown above in the weir equation) is a lumped parameter that includes the discharge coefficient, the gravitational constant, and constants based on geometric properties. 
                                                                                   
                                                                                                                              (2)
Where Cd is the discharge coefficient.  

The discharge coefficient is dimensionless and therefore it is the same in both English (U.S. Customary) Units and SI Units.  The weir coefficient, since it is a function of the gravitational constant, is not dimensionless and therefore has different values depending on which unit system you are using.  For example, a weir coefficient (C) of 3.00 in English Units would be 1.66 in SI units.  But both share the same discharge coefficient (Cd) of 0.56.  For convenience, to convert an English weir coefficient to an equivalent SI weir coefficient, multiply the English weir coefficient by 0.552.  
Be very cautious when considering C versus Cd.  They are different but are often mistakenly used interchangeably.  In fact, you’ll see the coefficient Cd labeled occasionally in the HEC-RAS software and literature when discussing weir coefficient. 

Ungated Inline Weirs. 
When defining inline flow over an “ungated” obstruction (bridge, culvert embankment, inline structure, SA/2D area connection), you have two options for computing weir flow:  Broad Crested and Ogee.   
Figure 1.  Inline structure weir embankment editor.

Both use the same standard weir equation presented above in equation (1).

The only difference between the Broad Crested Option and the Ogee Option is that for the Broad Crested option, the user enters a weir coefficient for C.  For the Ogee option, the user enters a spillway approach height and the ogee’s design energy head, and HEC-RAS will compute the weir coefficient for you.  This may sound convenient, but as the name implies, this option should really be used only for ogee-shaped spillways.  And you would have to know what the design energy head is, a design parameter that is not usually easy to come by, unless you have the hydraulic design report for the spillway.  With both options, submergence reduction of the discharge is automatically calculated with their own respective methods (FHWA ,1978 for broad crested, and COE, 1965 for ogee).

Ungated Lateral Weirs.
Lateral weirs are entered in the lateral structure editor.  Inside the lateral structure’s weir embankment editor, you’ll see two options for weir computations:  Standard Weir Eqn. and Hager’s Eqn.

Figure 2.  Lateral Weir Embankment Editor.

In version 5.0.1, the Standard Weir Eqn. provides four options for the weir crest shape:  Broad Crested, Ogee, Sharp Crested, and Zero Height.  Caution!  Zero Height is NOT used when Standard Weir Eqn. is selected.  This is a bug and will most likely be fixed for future versions.  If you do select Zero Height and Standard Weir Eqn. together, HEC-RAS will just use the weir coefficient you provide with the broad crested methodology.  Sharp Crested is not fully functional in Lateral Structures for version 5.0.1.  You’ll notice that no additional input options (like Rehbock and Kindsvater-Carter, as discussed under the next section, “Gated Weirs) are available when you select Sharp Crested in the lateral weir embankment editor.  My guess is that if you select Sharp Crested, it too will default to the broad crested methodology. 

Broad Crested and Ogee work the same as with the ungated inline structures.

With Hager’s Equation, all four weir crest shapes are available, including the zero-height weir.  The same weir equation is used, but an adjusted weir coefficient is computed based on physical and hydraulic properties.  Each of the four weir types has its own method for computing the adjusted weir coefficient.  There is an input box for “default weir coefficient”.  This is only used for the first iteration of solving Hager’s Equation.  Since Hager is a function of hydraulic properties, it must be solved in an iterative fashion.  After the first iteration, the adjusted weir coefficient will be computed and used.  Page 8-18 of the Hydraulic reference manual discusses Hager’s equation and how the adjusted weir coefficient is computed. 

Zero-height weirs are used for cases where flow will leave a channel laterally, but there is no defined obstruction or hydraulic control separating the two.  Commonly this is used to simulate flow from a main channel up a tributary that is being modeled using a lateral structure and a storage or 2D area.  The HEC-RAS 2D manual has a table of lateral weir coefficients (Table 1). 

Table 1.  Lateral Weir Coefficients (from the HEC-RAS 2D Manual, page 3-50).

Notice the last category is “non elevated” overbank terrain.  If you wish to use the weir coefficients in this table to simulate a non-elevated weir, do not use the Zero-Height weir.  That is strictly for Hager’s equation and Hager’s method automatically computes the weir coefficient.  Instead, use the broad crested standard equation and enter in the non-elevated weir coefficient there. 

Gated Weirs. 

When modeling gated spillways at inline structures or lateral structures, users can provide a weir coefficient for flow over the spillway when the gate is completely opened, and out of contact with the flow (Figure 3). This is different from the discharge coefficient used for flow over the top of the inline structure (Figure 1). 

Figure 3. Inline Gate Editor

With gated spillways, the user has three options for the weir shape:  Broad Crested, Sharp Crested, and Ogee (Figure 4).  Broad Crested and Ogee work the same as previously discussed.  The Sharp Crested option also uses the standard weir equation but gives you three options for determining the discharge coefficient:  user-entered, compute with the Rehbock equation, or compute with the Kindsvater-Carter equation.  For both the Rehbock and Kinsvater-Carter methods, the weir coefficient will be computed independently at each time step. So you can have a varying discharge coefficient for varying heads. 

Figure 4.  Inline Gate Editor.

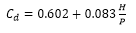
The Rehbock equation for the discharge coefficient was developed for rectangular weirs and is as follows:
                                                                                                                 (3)
Where P = Spillway approach height.  This value must be entered to use the Rehbock equation.  HEC-RAS will then compute the weir coefficient, C using equation (2).   According to Ippen (1950), this equation holds up well for values of H/P up to 5.  And it performs with fair approximation for H/P values up to 10. 

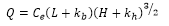
The Kindsvater-Carter method was developed in English units only and is as follows:

                                                                                                        (4)

Where Ce = effective weir coefficient, ft1/2/s
                kb= a correction factor to obtain effective weir crest length, ft
            kh= a correction factor with a constant value of 0.003 ft

The effective weir coefficient, Ce is a function of two ratios:  L/B and H/P, 

Where  L = Weir crest length
            B = Average width of the approach channel
            H = Energy head over the weir crest
            P = Spillway approach height

Ce is a function of both the relative width and relative depth of the approach channel and is taken from the following chart (note that the chart uses the variable h1 for H.  They are the same):

Figure 5.  Effective Weir Coefficient

kb is used to determine the effective length of the weir crest and is a function of the relative width of the approach channel.  It is taken from the following chart:

Figure 6.  Correction factor kb.

To use the Kindsvater-Carter method in HEC-RAS for a gated spillway, first select the weir shape as “Sharp Crested”.  Then select “Compute with Kinsvater-Carter eqn as the Weir Method.  You must then choose a relative approach channel width (L/b) and enter the spillway approach height, P (note, b is used in the HEC-RAS Inline Gate Editor for B.  They are the same). 

Figure 7.  Kindsvater-Carter Weir Method.

Remember, the Kindsvater-Carter equation was developed and is presented here in English units.  When using SI units, HEC-RAS will automatically convert the units appropriately.  So you can still enter a spillway approach height in meters if you are using SI units. 

The Kindsvater-Carter weir equation is built for rectangular weirs and “is particularly useful for installations where full crest contractions or full end contractions are difficult to achieve.”  (USBR 2001)  More information on the Kindsvater-Carter equation, including its limitations, can be found here:  http://www.usbr.gov/tsc/techreferences/mands/wmm/chap07_06.html

References:
Federal Highway Administration (FHWA), 1978.  Hydraulics of Bridge Waterways, Hydraulic Design Series No. 1, by Joseph N. Bradley, U.S. Department of Transportation, Second Edition, revised March 1978, Washington D.C.

Ippen, A.T. ,1950.  Channel Transitions and Controls, Chap. VIII in Hunter Rouse (editor): Engineering Hydraulics,” John Wiley & Sons, Inc., New York.  pp.496-588.

Unites State Bureau of Reclamation (USBR), 2001.  Water Measurement Manual, http://www.usbr.gov/tsc/techreferences/mands/wmm/

U.S. Army Corps of Engineers (COE), 1965.  Hydraulic Design of Spillways, EM 1110-2-1603, Plate 33.


Dam Breach Modeling and the Assessment of the Self Rescue Zone

$
0
0
An interesting and informative paperby Mr. Bruno Neves of Brazil on HEC-RAS dam breach modeling and determining the self rescue zone, as well as the timing for alerting residents of the self-rescue zone.  The concept is tested using HEC-RAS with hypothetical 2D breach scenarios of the Santa Branca Dam in the Paraíba do Sul River in São Paolo State, Brazil.  Included within the paper is a comprehensive review of some of the most widely used parametric breach equations used today.


 Bruno NEVES


ABSTRACT

Saving lives during dam break events is the main topic of this article, considering that a precise definition of the self-rescue zone (area in which authorities supposedly are not able to provide support to the population at risk in case of dam break, within the first minutes of the event) is crucial for planning mobilization of population in case of flood inundation. This paper presents a comparison of hydrographs, highlighting their dispersion through the self-saving zone, and sheds some light on issues of the hydraulic model.   


1.    INTRODUCTION

Despite the low probability of a dam break situation, around 0.0001 per year, this sort of hazardous event may cause significant damage and considerable loss of life (Medeiros, 2008).

In Brazil, federal law 12.334/2010 has set the National Policy of Dam Safety which defines obligations to the stakeholders of dams. Through National Agencies of Natural Recourses, details of this regulation are being defined.

ANA (National Water National Agency) and ANEEL (Electric Energy National Agency) agree in their regulations on the definition of the Self Rescue Zone, as follows: The downstream region of a dam where authorities are not able to provide assistance prior to the arrival of the flood wave in case of dam break alert, which is assumed to be 10 kilometers or the distance the front end of the rupture wave can travel in 30 minutes.
Colorado Department of Natural Resources (2010) regulates that the simulation of dam break events shall take place to characterize and identify locations which may be potentially threatened.

The bibliography shows diversity in modeling methods of breach opening which may lead to equally diverse results regarding potential damage in the self-rescue zone.
This paper cites details that may be considered when modeling a dam break event and sheds some light on results acquired from different breach opening equations. The US Army Corps of Engineers software HEC-RAS 5.0 (Hydrologic Engineering Centers River Analysis System) was used and applied to Santa Branca Dam, an earthen dam located in São Paulo state in Brazil.

HEC-RAS Dam Breach course in New Zealand and Round 2 of HEC-RAS 5.0 2D courses across Australia!

$
0
0
Dam breach course in New Zealand and Round 2 of HEC-RAS 5.0 2D courses across Australia!

We had a great turnout for our first HEC-RAS 2D course in Melbourne back in April, and I’m excited to be returning to the southern hemisphere in November to teach a 3-day HEC-RAS Dam Breach course to be held in Auckland, New Zealand.


November 29 - Dec 1, 2016

Our agenda will cover unsteady flow, level pool versus dynamic routing, breach parameters, setting up a dam breach model, diagnosing and fixing dam breach models, and presentation of 1D and 2D case studies.

Register your interest in this course here:  www.surfacewater.biz/auckland/

The course will be facilitated by Krey Price, who organised our Melbourne course and has wrapped up a full round of HEC-RAS 5.0 2D courses around Australia over the last three months; due to the overwhelming demand, Krey has now scheduled a second round of 2D courses across Australia:

·         Hobart 11-12 August 2016
·         Brisbane 25-26 August 2016
·         Sydney 1-2 September 2016
·         Perth 6-7 October 2016
·         Melbourne 20-21 October 2016

Why not combine your HEC-RAS training with a New Zealand or Australian vacation? All courses are open for registration for local residents as well as international attendees. International participants can contact Kreyfor a visa invitation letter or further details.


Controlling HEC-RAS using MATLAB


HEC Software Workshop London - Oct 25-26, 2016.

$
0
0
Would you like to meet the Director of HEC, Chris Dunn and the lead developers of HEC-RAS (Gary Brunner) and HEC-HMS (Matt Fleming)?

They will all be coming across to London on 25 and 26 October to meet with leading users of the software. It’s a great opportunity to learn more about the software and its future development path, and to exchange knowledge on how these products are used in Europe and the USA for flood risk management and also water resources and channel restoration work.


Over the two days there will be plenty of opportunities to speak to Chris, Gary and Matt and learn from the experts. Demonstrations and interactive workshops will feature the latest thinking, giving you practical solutions to take away with you.

There is also an opportunity to showcase your projects where the HEC software has been used focusing on the new functionalities and efficiencies.If you would like to submit a poster the deadline is 31 August, please email usin the first instance to register your interest and we will send you further guidelines for the poster submission.  


During the two days you will:
  • Learn how to build a HEC-HMS catchment model from scratch
  • How to apply the HEC software in hydraulic engineering, flood forecasting, flood risk mapping and catchment modelling projects
  • Explore how HEC-RAS Sediments (and some of the ‘hidden’ utilities) can help in your hydromorphology studies, scour, bank erosion and maintenance.
  • Discover how the reservoir system simulation software (HEC-ResSim), can be used to model reservoir operations at one or more reservoirs for a variety of operational goals and constraints.
To see the full programme of the workshops clickhere

Social Event – 25 October

image courtesy of Chris Wheal via Flickr Creative Commons

On the evening of 25 October there will be an optional social event to visit the largest movable flood barrier in the world - The Thames Barrier, followed by a buffet. Your guide will cover topics including the history of the river and the risk of flooding in London, the environment and wildlife of the Thames.

When: 25 - 26 October 2016

Where:Chartered Institution of Water and Environmental Management (CIWEM), London

If you’d like to join us and would like to find out more and book your place, please visit http://www.jbaconsulting.com/hec-software-workshop


Jeremy Benn FREng MA MSc FICE FCIWEM C.WEM MASCE MIEI CEng CEnv CEng(I)
Chief Executive

jeremy.benn@jbaconsulting.com
Jeremy is the Executive Chairman of JBA Consulting.  He has over 33 years’ water engineering, management and hydrology experience working in the UK and internationally.  He has published and lectured widely on these subjects.

He has been involved in the feasibility and detailed design of irrigation, drainage, flood walls, and storage reservoirs, ranging from culvert replacements to multi-million pound flood alleviation and land drainage schemes.

Jeremy has particular interests in computational hydraulics and hydrological modelling and is an acknowledged expert on the assessment and management of scour risk to engineering structures.


Optimizing Your Computer for Fast HEC-RAS Modeling

$
0
0
Written by Christopher Goodell, P.E., D.WRE  |  WEST Consultants 
and Gary Brunner, P.E., D.WRE  |  Hydrologic Engineering Center
Copyright © The RAS Solution 2016.  All rights reserved. 

Now that 2D modeling is becoming widespread in the HEC-RAS community, a lot of HEC-RAS users are wanting to know what kind of computer to build to maximize computation speed when running those large 2D datasets.  I had an opportunity to interview Gary Brunner about this and he had some valuable insight I’d like to pass along.


Before moving into suggestions for 2D modeling, let me first state that in 1D modeling, multiple processing cores are NOT used.  If you plan to only do 1D modeling, having extra cores will not help you with speed.  In this case, the processor speed is everything.  So get the fastest processor you can (e.g. 3.4 Ghz or higher).

For the rest of this post, I’ll assume you want to optimize your computer for 2D HEC-RAS modeling, since those are the models that typically will take longest to run.
  •  More processing cores is not always better.  In fact, it has been found that for smaller 2D areas (e.g. less than 10,000 cells or so), 8 cores may indeed run slower than 4 or 6 cores.  The reason behind this is that there is a level of computing overhead used just to transfer data between cores.  Fortunately, HEC-RAS has an option to change the number of cores you wish to use in the Computation Options and Tolerances window (from the unsteady flow analysis window…Options…Calculation Options and Tolerances…2D Flow Options tab).  For smaller datasets, I suggest experimenting with this to optimize computation speed.  “All Available” may not necessarily be the fastest.  But for large numbers of cells, you’re going to want as many cores as you can get your hands on.  Get as many cores as you can afford, but not at the expense of processor speed.  Try to get at least 3.2 to 3.4 Ghz or higher processors, no matter how many cores you get.
  • Processor speed is still paramount.  Do NOT think you will have fast HEC-RAS model run times just because you have a computer with 16 processing cores or more.  If all of your cores have slow processor speeds, you’ll get some benefit out of the number of cores, but you will be disappointed in the overall speed for a wide range of model types (1D/2D) and sizes.  So make sure even if you get a large number of cores, you are not doing so at the expense of fast processor clock speeds.  Again, 3.2 to 3.4 GHz or higher is a good clock speed for fast running models. 
  • Your hard drive is important.  Especially if you are producing a lot of output.   Small detailed output intervals, small mapping output intervals, writing computation level output, etc.  All of these settings affect how much and how often output is written to the hard drive during run time.  Solid state hard drives (SSD) are typically going to be better than the traditional spinning hard drive (HDD).
  • RAM is important, but not as much as you might think.  While RAM is definitely important, it is not as important for 2D modeling as number of cores and processor speed.  You do want enough RAM to run your operating system and have your entire HEC-RAS model in memory, without the operating system having to swap things in and out of memory.  That being said, if you plan to do multiple HEC-RAS models at the same time, or you have a habit of keeping lots of programs open and running in the background of your computer, you may want to get a computer with a lot of RAM.    I would venture to guess that if you are buying a computer with a lot of cores with fast clock speeds, your computer will have enough RAM.  But RAM is cheap, so you might as well load up on it while you’re building the HEC-RAS computer of your dreams. 
  • Graphics card does not matter.  While some of your other programs run best on a super-charged graphics card, HEC-RAS does not.  For HEC-RAS modeling, don’t waste your money on an expensive graphics card.  However, you may seem some noticeable improvement in the snappiness of image rendering or particle tracing with a better graphics card.  If money is no object, get a top-of-the-line graphics card, but this is one area you can sacrifice if you need to save some dough. 
To sum up, my recommendation for building a computer to optimize 2D runs in HEC-RAS is as follows:
  • Get as many processing cores as you can, but do not do so in expense of processor speed. 
  • Make sure your computer has processors that are 3.2 to 3.4 Ghz or even higher (the faster the better).  
  • Get an SSD hard drive
  • Max out your RAM.  
Pretty simple really.  And by the way, 24-inch (or larger) dual monitors really helps with viewing all those HEC-RAS windows you have open.  But if you have the means, why stop at two monitors?  


Starting on page 4-11 in the HEC-RAS 2D Manual, there is an interesting discussion on the effect of number of processing cores in computations.  I suggest giving it a read. 

What has been your experience with running fast HEC-RAS simulations on your computer?  Please leave a comment and share with us what you’ve learned about how your computer performs.  In fact, if you have a good picture of your suped up machine running HEC-RAS, please share!


HEC-RAS Version 5.0.2 is now available to download!

$
0
0
*Update:  Please note that HEC has removed HEC-RAS Version 5.0.2 from their website due to the discovery of a significant bug.  A newer version (5.0.3) will be posted soon.  Stay tuned...

HEC-RAS Version 5.0.2 is now available to download from http://www.hec.usace.army.mil/software/hec-ras/downloads.aspx

In addition to a number of bug fixes there are some new features.  Here are a few:
  • Option to use 2D Flow Equations over lateral structures.
  • Flow and Volume output on profile lines in RAS Mapper.
  • Legend added to active results layer in RAS Mapper.
Please read the HEC-RAS 5.0.2 Release Notes for more detail on these and other new features, as well as a comprehensive list of bug fixes.  

Enjoy!


HEC-RAS 2D Course in Concepcion, Chile November 8-10, 2016

$
0
0
If you are in the neighborhood, how about joining me for a course in HEC-RAS 2D modeling at the Universidad Católica de la Santísima Concepción (Catholic University of Concepcion), Chile November 8-10, 2016.


Please visit the University's website for more information and to register. http://www.ucsc.cl/postgrado/curso-two-dimensional-modeling-using-hec-ras-5-0/


Space will be limited, so don't delay signing up.  Hope to see you there!   


HEC-RAS Dam Breach course in New Zealand!

$
0
0
Limited-time early-bird discounts available

Registrations are now available for our dam breach course in Auckland, New Zealand to be held from 29 November to 1 December 2016.  I will be teaching this course with help from Mr. Krey Price of Surface Water Solutions.  Please come and join us!

We have fewer than ten places remaining, so please register soon to confirm your place!
A $250 early-bird discount is available using coupon code “earlybird” at checkout.
Our agenda will cover unsteady flow, level pool versus dynamic routing, breach parameters, setting up a dam breach model, diagnosing and fixing dam breach models, and presentation of 1D and 2D case studies. Hope to see you there! 
Viewing all 200 articles
Browse latest View live